May 21, 2019
How to Prove Your RCM ROI: What, When and How to Measure

The return on investment (ROI) calculation for revenue cycle management is simple: Take your hospital’s revenue, subtract your RCM expenses, and divide by those same expenses to get your ROI.
Unfortunately, nothing in RCM is ever that easy.
While quarterly or annual revenues are readily available, it is much more challenging to define and calculate the costs associated with revenue cycle management. You could calculate RCM ROI using any RCM technology investments, employee expenses (salaries and benefits for those involved in RCM activities, claims denial management, etc.), and costs of printing and mailing paper statements — but that may not tell the full story.
Less Money Out, More Money In
Many hospitals and health systems turn to end-to-end RCM outsourcing and RCM software to boost efficiencies. These solutions and services can help healthcare organizations take control of critical front- and back-office functions, billing processes, claims and denials management, proactive patient engagement, predictive analytics, and business intelligence. 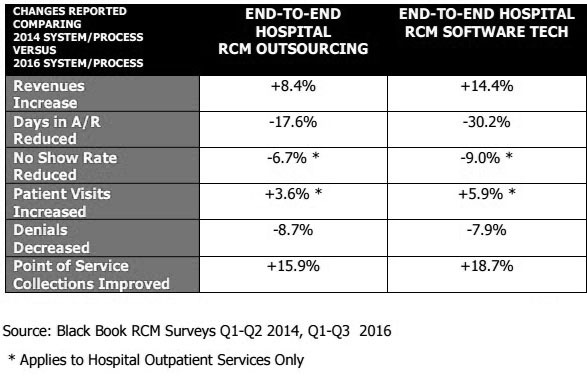
With end-to-end revenue cycle management solutions, you have to look past revenue and ROI to get the full view of the impact. Look for efficiency gains in other areas like no-show rates, number of visits, days in AR, cost to collect, and more.
ROI alone won’t prove your RCM department’s or technology investment’s worth. Here are seven other metrics to measure — at least quarterly — to get a better sense of how RCM is impacting the organization.
Beyond ROI: Other RCM Metrics to Analyze
Days in Accounts Receivable
The faster you can collect a balance, the fewer resources you have to spend reminding patients to pay. Days in AR is one of the most important metrics to track for RCM.
Simply divide the total charges in a time period by the total number of days in that time period to get your average daily charges. Then divide the total accounts receivable by the average daily charges to get your days in AR.
Time to Cash
On average, how long does it take a payment to post? Payments collected online or through interactive voice response (IVR) calls can post the next day, while those sent via postal mail can take seven to ten days to post.
Cost to Collect
It will take some extra work and accurate estimations to calculate the costs of the manual labor associated with collections, but it’s worth it to get a good sense of your cost to collect.
First, determine the combined expenses of all employees (salaries and benefits) devoted to collections processes in a given timeframe and combine that with any IT and material costs (technology, paper, printing, postage, etc.). Then divide by the amount collected (both settled payments and recovered bad debt) in that same timeframe.
Our proprietary analysis has shown that the typical cost to collect using online and IVR channels is $0.30 to $0.84 per payment, while it costs about $2.50 per payment to collect via traditional customer service representatives.
Inbound IVR is a more efficient way to handle incoming phone calls with intelligent automation. Our customers typically reduce attended inbound calls by 15 to 30 percent with IVR.
Average Time From Statement to Payment
With proper patient segmentation, statement design, and messaging, you can optimize the number of payments received after just one statement. Measure the average number of days from sending the first statement to receiving payment. Also, document the average number of touches it takes to receive payments in full.
The more efficient you can be, the more money and time you’ll save to collect more revenue faster.
The Payment Landscape
Identify the payment sources that are contributing the most revenue so you can identify weak spots and look for opportunities to shift the payment landscape to lower-touch channels. Your RCM solution provider should be able to significantly shift your payment structure to earn a higher ratio of self-service payments to traditional payments.
We like to track metrics like total payments, amount paid, average payment, percent guarantors paying, and percent dollars collected from each payment channel, including lockbox payments, patient portals, inbound IVR, and outbound IVR.
No Shows and Patient Visits
No shows are costly and can put a severe dent in productivity. It’s important to track your no-show rates closely in addition to patient visits so you can improve upon both metrics.
One way to get patients to honor their appointments is through proactive appointment reminders communicated via the channels patients prefer. Measure the most responsive and effective communication channels for your patient population so you know how to reach them with essential reminders.
Denials
The Advisory Board found that 90 percent of denied claims are preventable and that two-thirds of denials are recoverable.
We previously reported that the amount of uncollectable denials hospitals wrote off increased by 90 percent during a six-year period, and that successful appeals fell from 56 to 45 percent over two years. Read more about opportunities in denials management in our post, The Denials Are Coming. Are You Ready?
With denied revenue representing around ten percent of a hospital’s total revenue, you can’t afford inefficiencies in denials management.
For tips on selecting a proven RCM vendor, check out some of the criteria that healthcare analyst Black Book Market Research uses to rank the best healthcare revenue cycle management software and services.
RevSpring Can Help
Integrated payment communication is part of RevSpring’s DNA. We tailor the payment conversation to influence behavior and inspire action. Our segmentation rules and workflows help you become hyper-focused on the patient, understanding their ability to pay and mapping their financial obligations to repayment pathways.
If you’d like to learn more about our comprehensive patient engagement and billing solutions, we’d love to help you. Request a demo to see how we can help your organization meet its goals.


